
Bitcoin is flashing a new technical warning after slipping below a widely watched long-term weekly moving average, a move traders often interpret as a sign that downside momentum is gaining control.
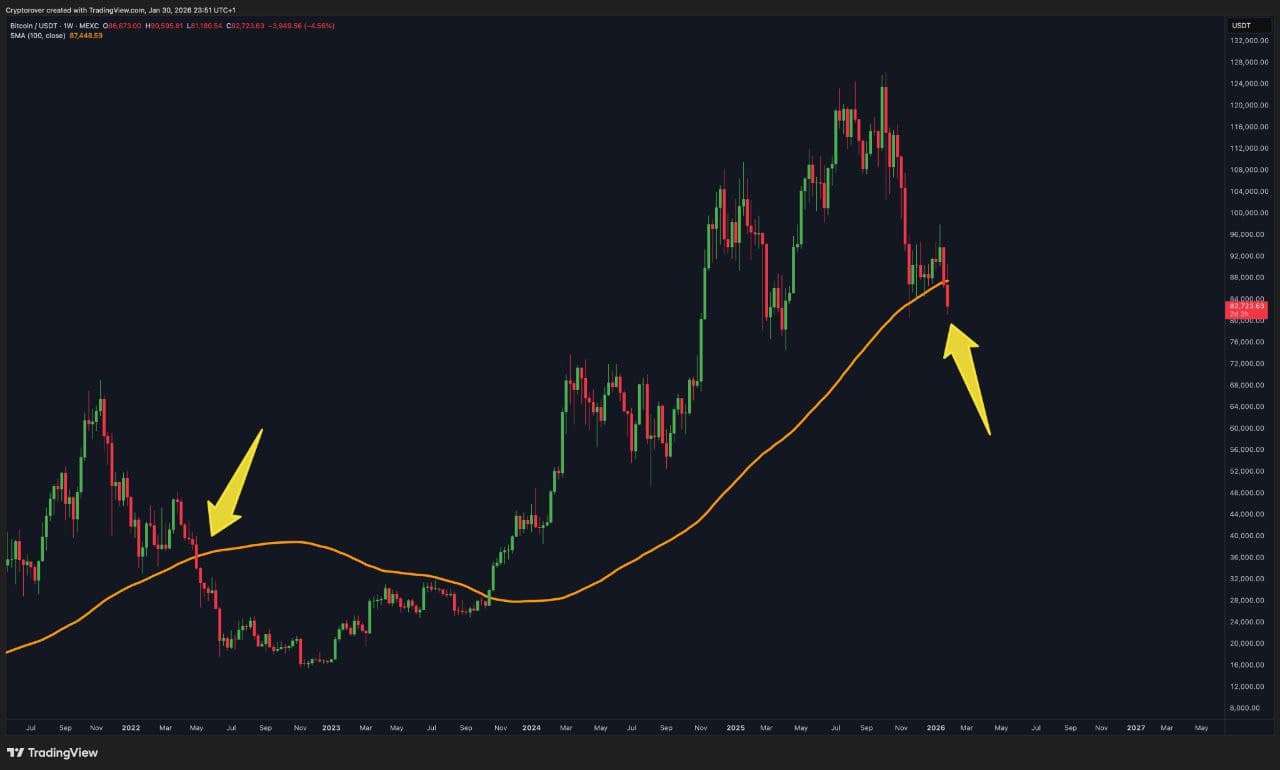
On a weekly BTC/USDT chart from TradingView using MEXC pricing, bitcoin was shown trading around 82,723 while the 100-week simple moving average sat near 87,449, placing price notably below the trend line that often acts as support during bull-to-bear transitions.
Key Takeaways
- Bitcoin fell below its 100-week SMA on the weekly chart, a level many traders use to gauge long-term trend strength.
- The break increases the probability of continued volatility and “sell-the-rally” price action in the near term.
- Recent structure suggests a shift from higher highs to lower highs, which can reinforce bearish momentum.
- Macro events and derivatives positioning could amplify moves if liquidity thins during risk-off periods.
Why the 100-Week SMA Matters to Traders
Long-duration moving averages like the 100-week SMA are popular because they smooth out short-term noise and often align with broader risk sentiment. When bitcoin trades above that line, dip-buyers tend to view pullbacks as potential re-entry zones; when price loses the line, the same level can flip into resistance where sellers look to defend rebounds.
The chart shared via TradingView highlights this dynamic by showing price crossing beneath the orange moving average, a technical development that some market participants treat as a regime change rather than a routine pullback.
Chart Structure Is Tilting More Defensive
Beyond the moving-average break, the latest swing sequence on the weekly timeframe appears less constructive, with a sharp drop following a topping region and subsequent attempts to bounce that failed to reclaim prior highs. This type of structure can create overhead supply as traders who bought late in the upswing look to exit on rebounds.
In practical terms, technicians typically watch whether price can reclaim the broken moving average and hold it for multiple weekly closes, or whether rallies stall below it and roll over again.
What Confirmation Would Look Like
Traders usually look for confirmation rather than reacting to a single candle. A decisive weekly close back above the 100-week SMA, followed by a successful retest as support, would often be treated as an early sign that sellers are losing control. On the other hand, repeated rejections near the moving average can reinforce a bearish bias and keep pressure on spot demand.
Volume behavior also matters: rising sell volume during declines and weak buy volume during rebounds tends to support the case that sentiment is still defensive.
Derivatives and Macro Can Add Fuel to the Move
Derivatives markets can magnify price swings when liquidations accelerate in one direction. Traders frequently monitor leverage and positioning across major venues, and the Chicago Mercantile Exchange (CME) regularly publishes bitcoin futures and options data that institutions use to gauge risk appetite.
At the same time, broader macro drivers can matter for crypto beta. Rate expectations, dollar strength, and risk positioning across equities can all influence whether traders treat bitcoin as a high-volatility risk asset or a relative safe-haven within the crypto complex.
Read Also: Bitcoin Slides Below $85,000 as Rapid Sell-Off Triggers $430 Million in Liquidations